We Are Involved Media
Where service you can trust meets high impact clout.
- Send Email
- Call
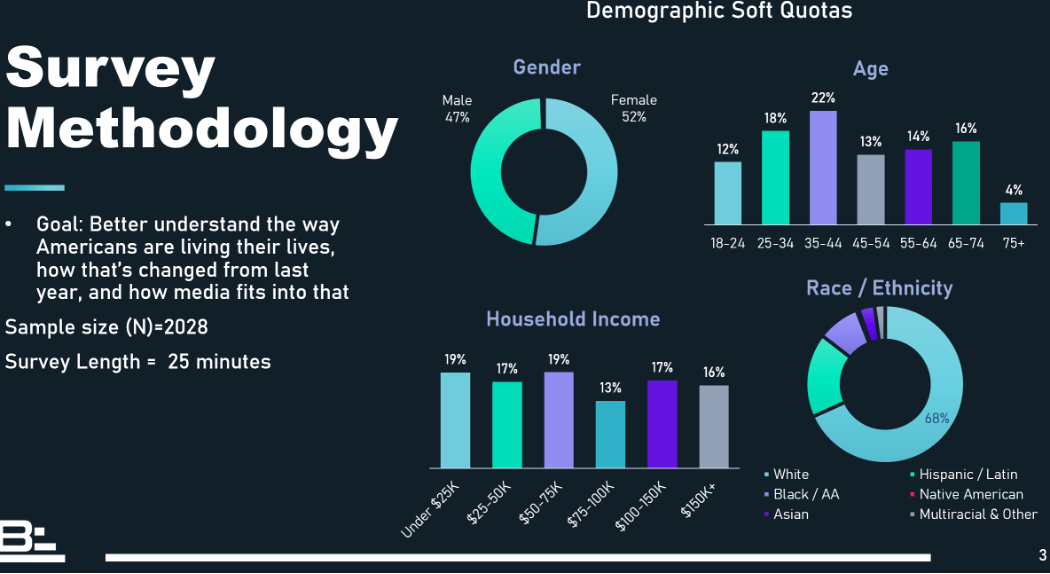
Changing Media Lifestyles
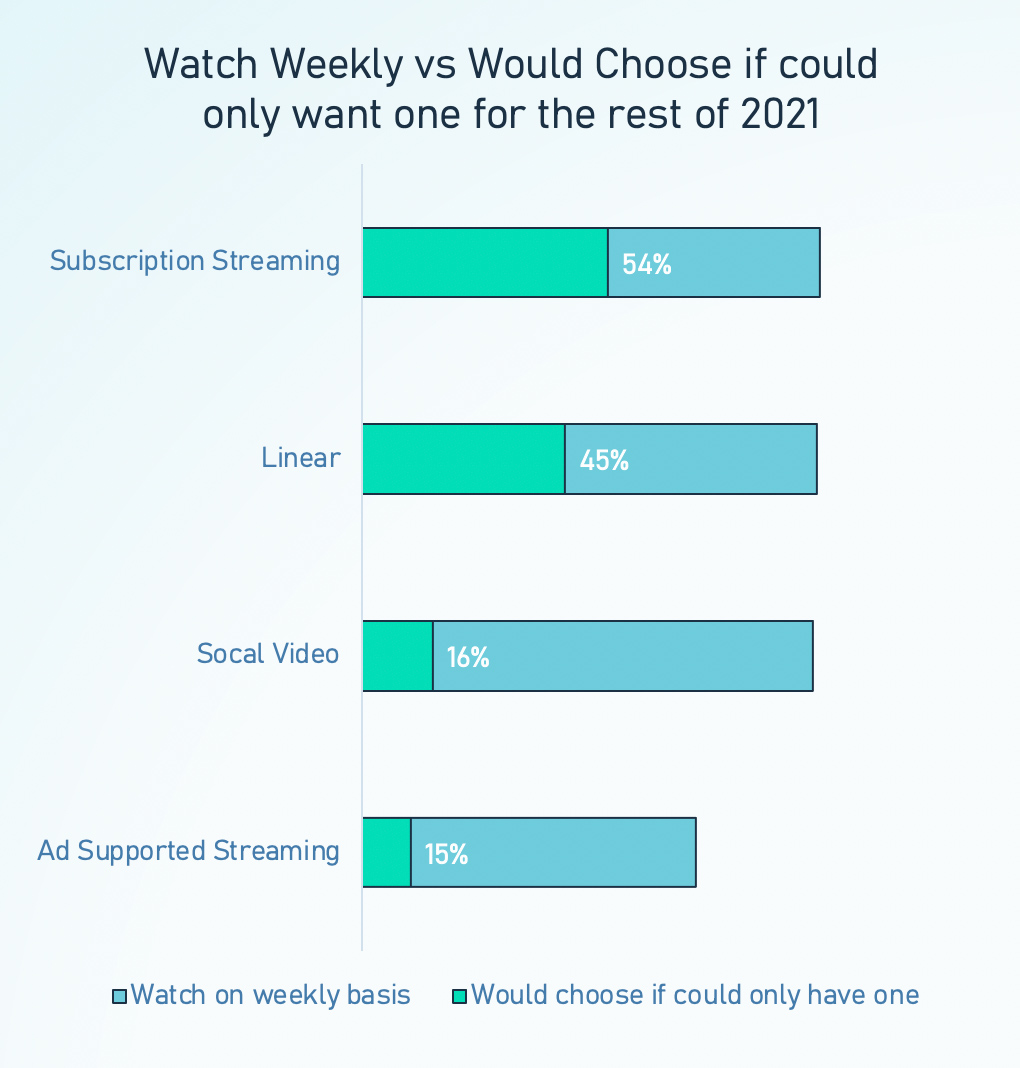
May 3, 2021 |While most Americans still turn to linear TV for daily unscripted programming like news, game shows and talk shows, subscriptions services have won hearts and minds. Driven by successes in emotionally resonant scripted genres like comedy, drama, and now recent movie releases, nearly 60% of SVOD users say it’s their most essential video platform.
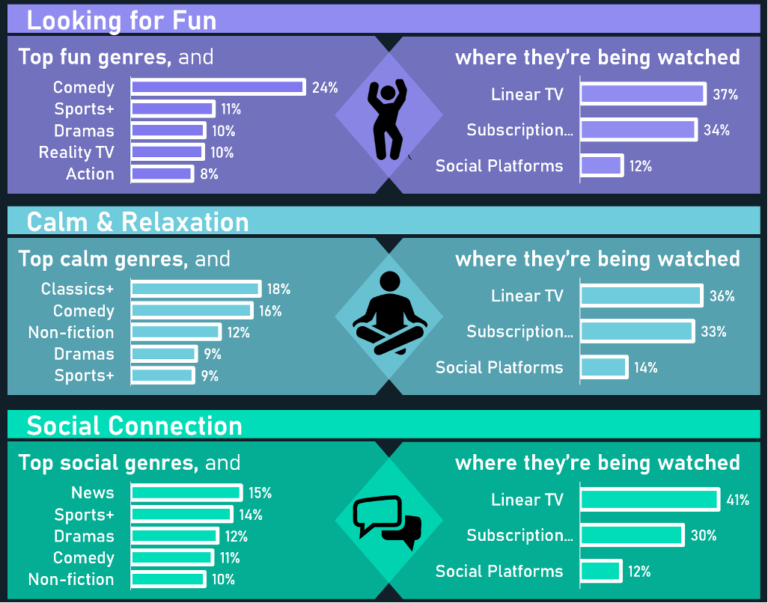
Linear TV – a.k.a. broadcast and cable channels – remains the most-often watched media. But while it is a part of daily consumers lives, they seek out different content on different platforms. Linear leads in daily content such as news and sports, but subscription services are preferred for less time sensitive content such as investigative non-fiction series or scripted dramas.
Where consumers go when they are looking for…