[Infographic] Connected Audience Fall 2024 Report – Connected Video Audiences
December 3, 2024 | Involved Media Research TeamOur Connected Audience series surveys US consumers about media habits across traditional and streaming channels to help brands better connect with their audiences.
In our latest infographic, we focus on connected video audiences among the leading streaming platforms.
Genres Watched Regularly
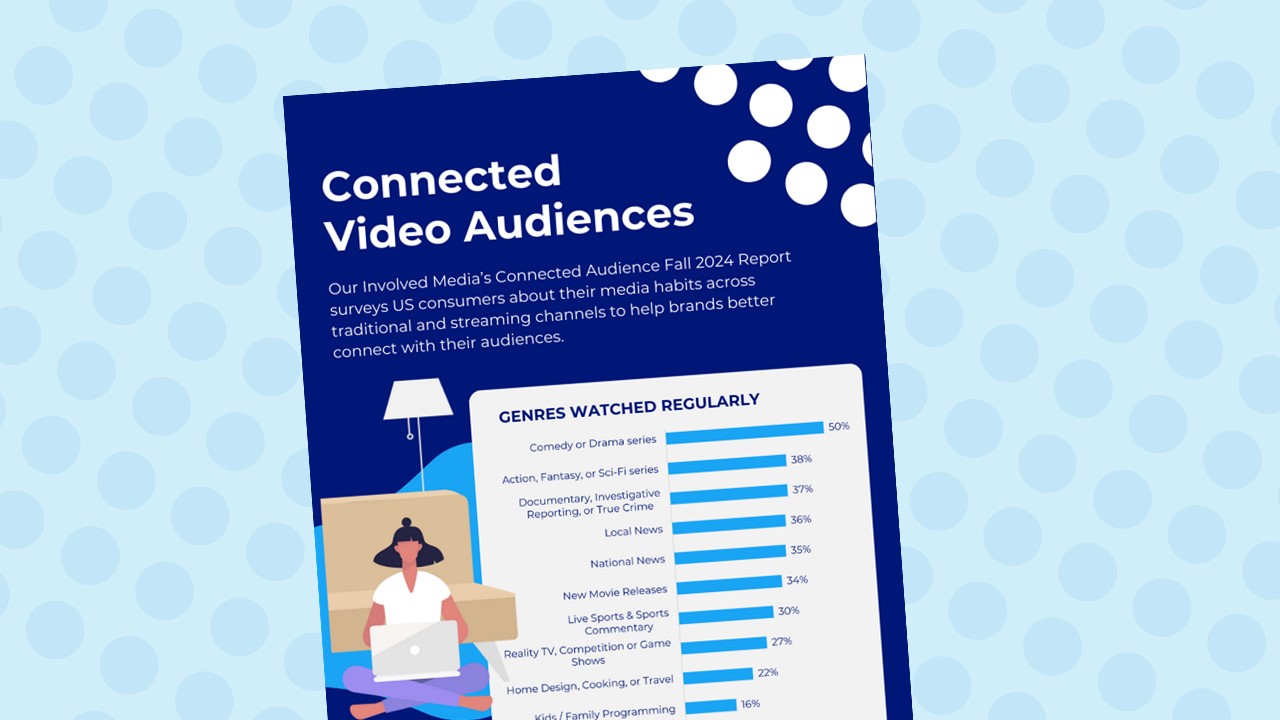
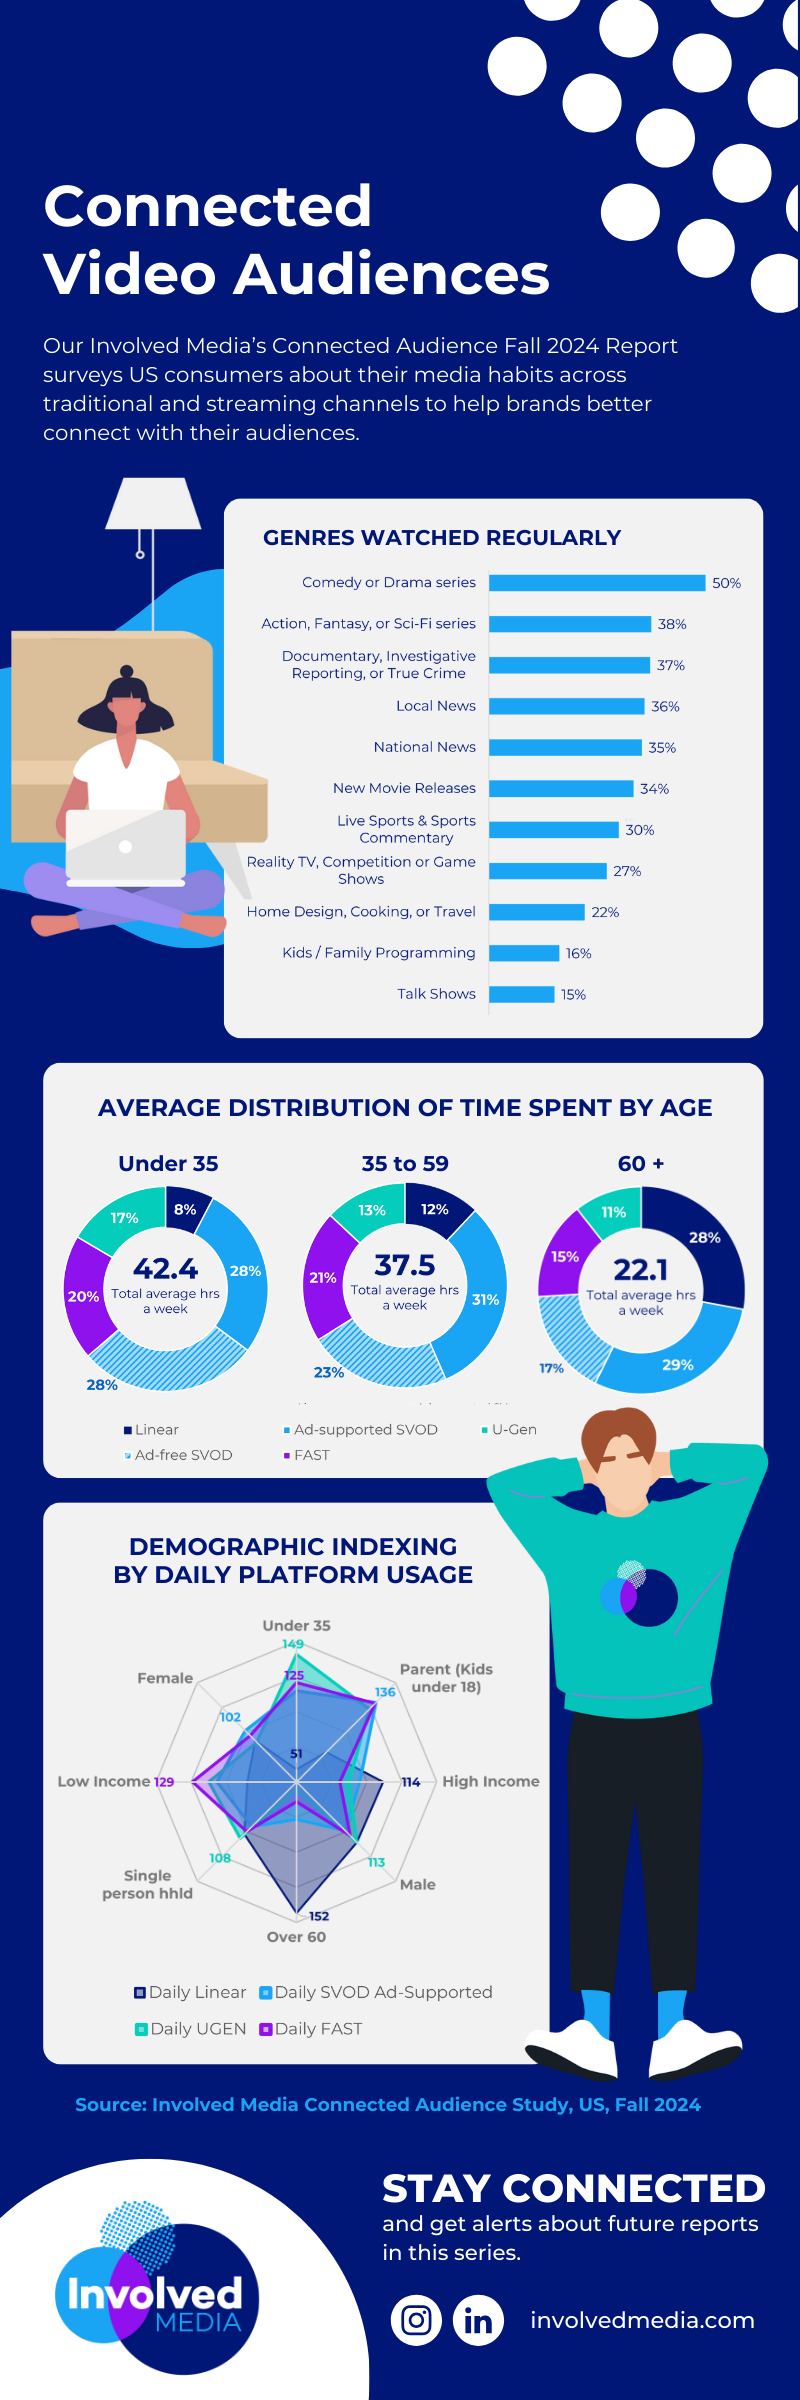
- Comedy and drama series are the genres that are watched the most, with 50% of respondents stating that they watch them regularly.
Average Distribution of Time Spent by Age
- Respondents under the age of 35 spend an average of 42.4% hours a week watching video, with a combined 56% watching Ad-Free SVOD and Ad-Supported SVOD.
- Respondents between the ages of 35-59 spend an average of 37.5 hours a week watching video, with the highest time watching Ad-Supported SVOD.
-
- 35-59 year olds also spent the most time watching FAST Channels out of all age groups.
- Respondents that are 60 and older spend an average of 22.1 hours a week watching video, with the most time watching Ad-Supported SVOD and Linear.
-
Demographic Indexing by Daily Platform Usage
-
- FAST Channels are leading with viewers under 35.
- Linear is outperforming SVODs with high-income respondents.


